So, a buddy comes in. She’s been grinding her teeth over recent, seemingly extreme, market volatility – large moves to the upside and large moves to the downside. She’s wondering if this is something new, unusual or predictive such that we should be taking some trading action.
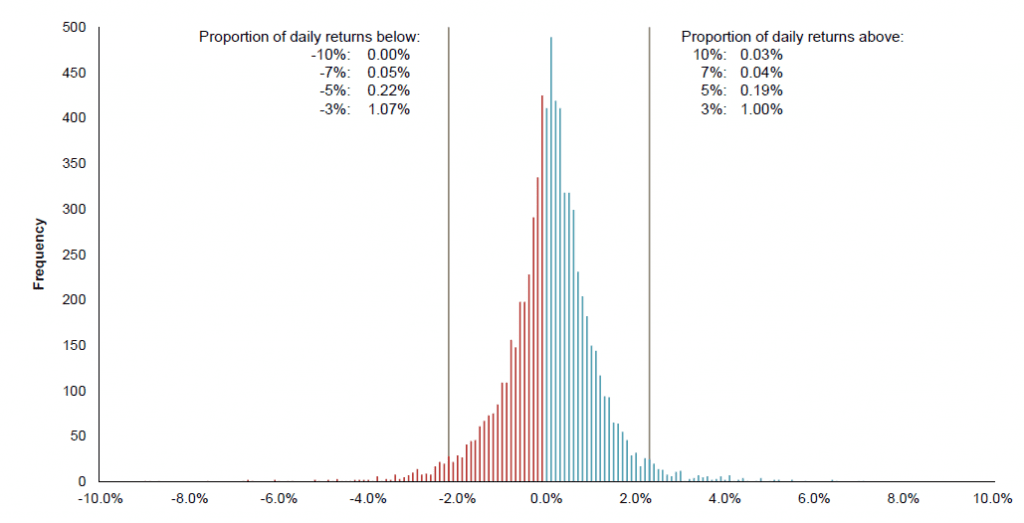
History reveals that large daily upside or downside moves occur with some regularity. A graph below reveals the “Distribution of US Large Cap Market’s Daily Returns from January 1990 – December 2018”. An examination of this information reveals:
Exhibit 1: Distribution of US Large Cap Market’s Daily Returns from January 1990 – December 2018

In US dollars. US Large Cap is the S&P 500 Index. S&P data 2019 S&P Dow Jones Indices LLC, a division of S&P Global. All rights reserved. The information shown here is derived from the index. Past performance is not a guarantee of future results. Indices are not available for direct investment; therefore, their performance does not reflect the expenses associated with the management of an actual portfolio. Values change frequently and past performance may not be repeated. There is always the risk that an investor may lose money.
- A 3%* market move up or down occurred on about 1% of trading days in the 29 years studied.
- Given approximately 250 trading days annually – investors could expect 2-3 daily moves up and 2-3 daily moves down in the 3% range annually.
- Some years there could be more and some years there could be fewer ‘big move days’.
- More extreme percentage upside or downside moves do occur, but, even less frequently**.
Toward answering the question of “is this volatility unusual such that we should be taking some trading action”– we have found no statistically-significant evidence that short-term volatility – be that volatility modest or extreme – is predictive of future market direction. Advice to the contrary
is speculative.
Knowing that “volatility happens in the market”, we recommend for our clients All-Weather Wealth Management Plans designed to achieve our client’s long-term needs for currency while being able to withstand market moves to the downside or upside – be those downside moves short-term or protracted. Trusting this will find you well and not grinding your teeth over market volatility that is neither predictive nor unprecedented, we remain
Yours truly,
Warburton Capital Management
*As of August 14th, 2019, a 3% market move represents about 750 Dow Jones 30 Industrials points or 85 S&P 500 points.
**“Market movement” is referencing daily movement of the S&P 500 Index. All data is sourced from index history.


