
Warburton Capital Management
“Imminent Yield Curve Inversion”
So, a buddy comes in. Our buddy says “Jim Cramer is ranting that the Imminent Yield Curve Inversion is a Harbinger of Doom for stock and bond investors”. Conveniently, my buddies at DIMENSIONAL recently sent me a few slides relevant to this discussion…so…here we go!
First of all, ‘What is a Yield Curve Inversion’? Essentially, a Yield Curve Inversion exists when 2-Year Treasuries yield more than 10-Year Treasuries. Historically, yield curves have sloped upward (short-term rates lower than long-term rates), however, there have been many periods in the US and around the Globe when local yield curves have been flat or inverted. Yield curves provide us with a picture of how yields vary with bonds of similar credit quality – but different maturities – at a particular point in time. Bond yields change and yield curves change shape hundreds of time each day as markets digest news and events around the world.
Exhibit 1 presents the US Treasury yield curve on the last trading day of September for the last three years. Rates across the entire curve have moved higher since 2016, however, short-term rates moved up more than long-term rates leading to a “flattening” of the yield curve slope.
Exhibit 1: The US Treasury Yield Curve Has Flattened in 2018

US Treasury yield curve data (monthly) obtained from US Department of the Treasury website. Past performance is no guarantee of future results.
YIELD CURVE INVERSIONS AND us stock market PERFORMANCE
The question posed by our buddy is whether yield curve inversions are a ‘Harbinger Of Doom For Stock/Bond Investors’. While US yield curve inversions may concern investors – and excite Jim Cramer to rant/speculate about an ‘Imminent Yield Curve Inversion And It’s Market Impact’ – the small and infrequent number of examples of these phenomena – in the US or around the world – makes it imprudent to conclude there is statistical significance, imply correlation or extrapolate causation.
Exhibit 2 illustrates the growth of a hypothetical $1,000 investment in the S&P 500 Index since June 1976 plotted against the difference between 10-year and 2-year Treasury yields. This difference or ‘term spread’ – term spread is the yield difference between bonds with different maturities but similar credit quality – is a commonly used measure of yield curve steepness.
(Indicated on the chart are the onset of the four periods when the yield curve inverted for at least two consecutive months as short-term rates began to exceed long-term rates.)
Exhibit 2: Relationship Between Yield Curve Inversions & US Stock Market Performance
Monthly Data: June 1976–September 2018
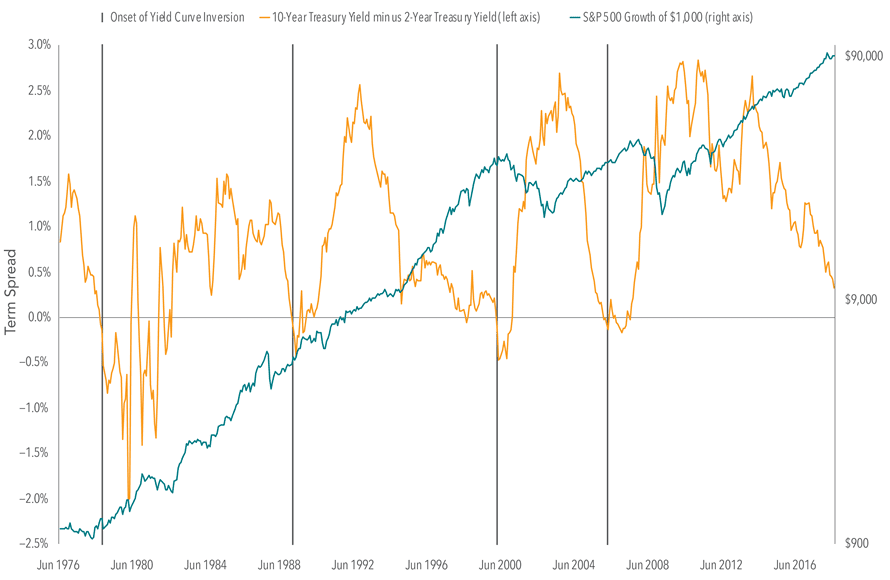
US Treasury yield curve data (monthly) obtained from FRED, Federal Reserve Bank of St. Louis. S&P 500 Index © 2018 S&P Dow Jones Indices LLC, a division of S&P Global. All rights reserved. Indices are not available for direct investment. Their performance does not reflect the expenses associated with the management of an actual portfolio. Past performance is no guarantee of future results.
The inversion prior to the 2008 financial crisis is interesting to review in terms of my unstated but implied ‘Yield Curve Inversions Are An Ineffective Market Timing Tool’ argument. The US yield curve inverted in February 2006, after which the S&P 500 Index posted a positive 12-month return. The yield curve’s slope became positive again in June 2007, well prior to the market’s major downturn from October 2007 through February 2009.
If an investor had interpreted the 2006 inversion as a sign of an imminent stock market decline – being out of stocks during the inverted period would have resulted in missing out on gains. Conversely, if an investor bought stocks in 2007 when the curve’s slope became positive, that investor would have been invested during a substantial stock market decline.
OBSERVING YIELD CURVE INVERSION DATA AROUND THE GLOBE
The small number of US yield curve inversions over the last 40 years makes it seemingly impossible to draw strong conclusions about the effect on stock market performance. Let’s look at other countries to observe the relation between inversions and subsequent market returns.
Exhibit 3 examines the US and five major developed nations since 1985 and shows the hypothetical growth of 1,000 units of each country’s local currency invested in the local stock market index a month before yield curve inversions began.
Exhibit 3: Stock Market Performance in Selected Developed Countries
Following a Yield Curve Inversion
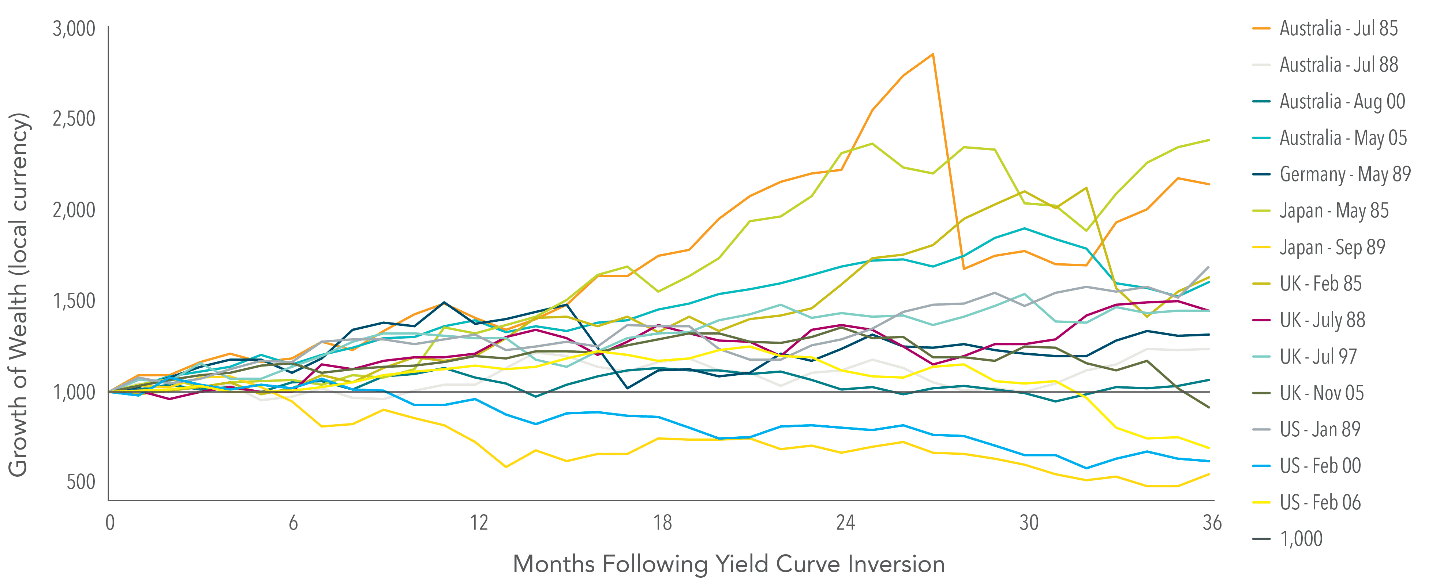
Yield curve inversions based on 2-year and 10-year government bond yields for each country. Yields obtained from Reserve Bank of Australia, Bundesbank, Japanese Ministry of Finance, Bank of England, European Central Bank, and US Federal Reserve. Stock returns based on local currency MSCI indices. MSCI Australia Index (gross div., AUD), MSCI Germany Index (gross div., EUR), MSCI Japan Index (gross div., JPY), MSCI United Kingdom Index (gross div., GBP), MSCI USA Index (gross div., USD.) These countries were selected to represent the world’s major developed country currencies. Indices are not available for direct investment. Their performance does not reflect the expenses associated with the management of an actual portfolio. MSCI data © MSCI 2018, all rights reserved. Past performance is no guarantee of future results.
71% of the time (10 out of 14 cases of inversion), local investors experienced positive returns in their home stock markets for the 36 months beginning one month before a yield curve inversion! By comparison, 77% of the time the US and these five major developed nations rewarded local investors with positive returns over 36 months during this same time period without regard to the shape of the yield curve! (Kinda seems like the same number? 71% vs 77%?)
As I’ve pointed out, this data set is limited and we should not infer statistical significance. This analysis of yield curve inversions in the US and five major developed countries does show that An Inversion Does Not Seem To Be A Reliable Predictor Of Stock Market Downturns – or – a “Harbinger of Doom” as Jim Cramer was quoted by our buddy as having said. While a yield curve inversion may be an indication of unusual credit markets, it doesn’t appear to be a statistically significant market timing tool. Stocks can rise – and the economy can grow – for many months when a yield curve becomes – and remains – inverted.
CONCLUSION
Yield Curve Inversions appear to be predictive of nothing.
None of what is currently manifested in the credit markets predicts market direction or looming trouble…in my always humble – and never guaranteed – opinion. So, what can we investors do if we are concerned about potential stock/bond market weakness today, tomorrow, next week, next month or at any time in the future brought on by whatever headline or economic phenomena thrusts itself onto our radar screen?
I know I am as boring as a wet ball of cotton, however, at Warburton Capital we continue to stake our reputations on and serve our clients by recommending derivation of a Purposeful Comprehensive Wealth Management Plan that includes the non-negotiable elements of Safe Assets Set Aside For Spending Needs and Discipline.
By developing and sticking to a long-term plan that reflects each investors’ uniquely personal goals, values, needs, resources and obligations, we believe each investor enhances the likelihood of achieving FINANCIAL SUCCESS – be that ‘Not Running Out Of Money’ or something even more ambitious like ‘Becoming Richer Than Warren Buffet’!
As regards my buddies’ love for Jim Cramer…I’m right there with him! I love watching the entertaining and useless Jim Cramer. Cramer is more fun than a barrel of monkeys, however, he ain’t even close to being as entertaining as a 120 decibel AC/DC Concert! (Please, play ‘You Shook Me All Night Long’ one more time and turn it up!)
With appreciation to my DIMENSIONAL buddies for their timely/proactive delivery of the Yield Curve Inversion slides, and trusting this missive will find you enjoying life, ignoring the Headlines and not stressing out over the speculations of the Financial Press.
Warburton Capital Management
